 Blogging The Boys
The Cowboys’ pass rush was better than its 35 sacks suggest. In fact, when measuring total pressures rather than sacks, Dallas’ front seven ranked sixth in the NFL in 2025.
Surprised? Read on.
It used to be that the key to slowing down modern offenses was to get pressure on the passer. The assumption was that if the quarterback is pressured or hurried, it’s much more likely he’ll make a mistake and turn the ball over or make enough bad passes to get off the field.
Of course, pressuring the passer only works if your secondary is any good. And the 2025 Cowboys secondary was the exact opposite of whatever “good” is.
In the NFL, pressure has traditionally been measured by sacks. And at first glance, the 2025 Cowboys pass rush wasn’t very good, ranking only T22nd with 35 sacks.
But considering that NFL QBs last year only held the ball between 2.2 – 2.5 seconds on average, just penetrating the pocket and pressuring the QB to throw early must be considered a success for the defense.
So to get a true feel for the effectiveness of the pass rush, you’ve got to measure a defense’s ability to pressure the quarterback, either in form of sacks, hits, or hurries.
And that’s exactly what we’re going to do today. We’re first going to look at the total pressures generated by the interior D-line, then the pressure generated by the edge rushers, and then try to figure out what both of it means for 2026.
In addition to sacks, the folks at Pro Football Focus (PFF) also keep track of QB hits and QB hurries. By their definition, a hit is when a QB is knocked down but not sacked, a hurry is when a QB is forced to move in the pocket in some other way than simply stepping up in the pocket to throw.
Add up all three and divide the sum by the total pass rushing snaps and you get a number which we’ll call pressure percentage. Across the NFL last year, interior defenders averaged a pressure percentage of 7.8%, while edge defenders averaged a 11.8% pressure percentage.
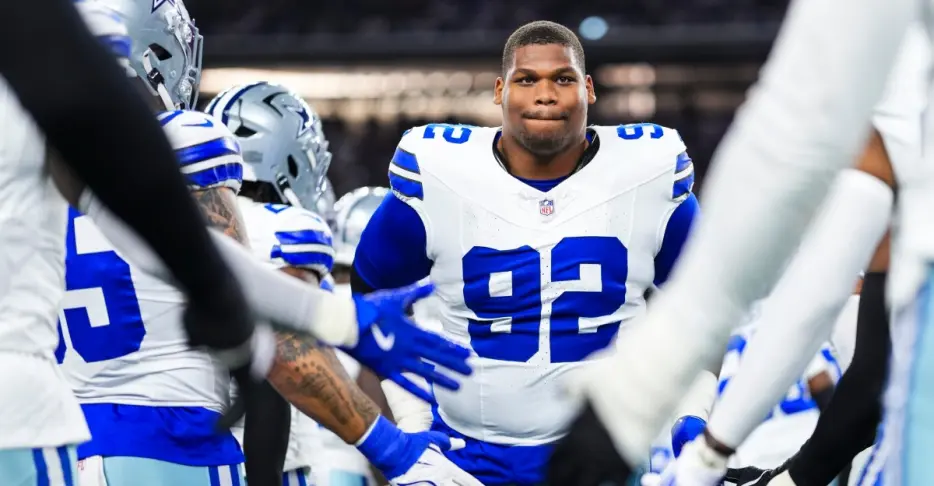
On paper, the Cowboys got a big boost when they added Quinnen Williams in the middle of the season last year, But did his addition actually lead to improved numbers for the D-line? Boy, did it ever! The chart below splits the DT performance into a pre-Williams and post-Williams phase and shows the pass rush snaps (PRSH), the total pressures (PRSS) and the pressure percentage (PRSS%) for each player.
body .sbnu-legacy-content-table td, body .sbnu-legacy-content-table th, body .sbnu-legacy-content-table { border: 1px solid #000 !important; border-collapse: collapse !important; } body .sbnu-legacy-content-table td, body .sbnu-legacy-content-table th { padding: 0px 6px !important; } 2025 Cowboys DI pressures Player****Pre-Williams (Weeks 1-9) Post-Williams (Weeks 11-18) Total PRSHSKHITHURPRSS****PRSS% PRSHSKHITHURPRSS****PRSS% PRSS% Kenny Clark25132222710.8% 2111412178.1% 9.5%Osa Odighizuwa22419152511.1% 196211142713.8% 12.4%Solomon Thomas15702795.7% 7601233.9% 5.2%Quinnen Williams 19527233216.4% 16.4%Jay Toia3301013.0% 1100000.0% 2.3%Perrion Winfrey 16002212.5% 12.5%Total6674144462****9.3% 7055235381****11.5% **10.4%**Williams wasn’t just an...