 Stampede Blue
Each week during the season, I will be walking through the data from the previous Colts game and analyzing the numbers to form a sort of “what happened” narrative, as well as comparing the Colts against all other teams in the league. For a glossary of the stats listed, reference Season Stats. Thanks to Pro Football Reference, NFL.com, Football Outsiders, and the nflFastR project for being awesome sources of weekly data.
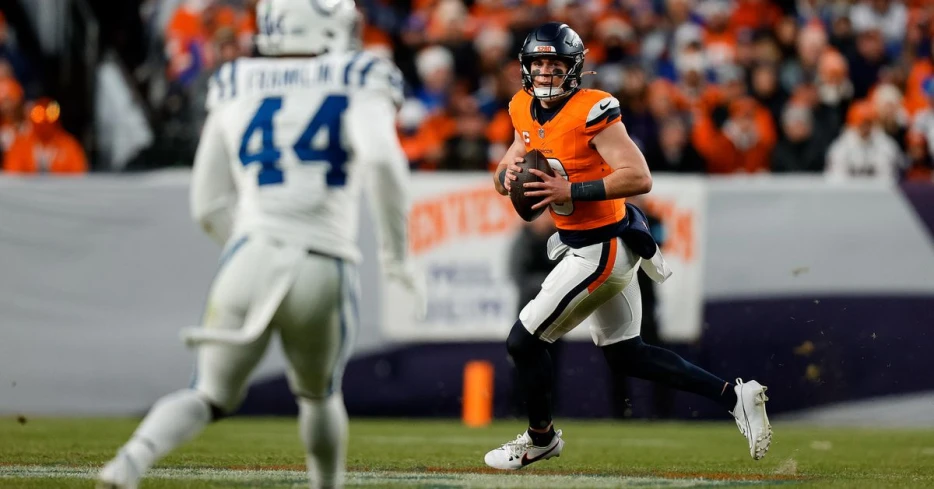
Contrary to the narrative of momentum killing the Colts players, the Indy defense actually played well all game against the Broncos. On paper, 31 points seems like a lot to give up, but 7 of those points were given up by the offense and 17 more were yielded off of short fields thanks to offensive turnovers and poor special teams coverage.
The Colts limited the Denver offense to under 200 yards total and only 13 first downs for a 56.5% Drive Success Rate, which puts the defense in the 92nd percentile.
The cumulative EPA per play chart below shows how well the Colts offense played after surrendering the first Denver touchdown (play 23). The graph continues to climb throughout the game (up is good) never stalling even after J.T.’s fumble, which happened in the offensive series right after the red dot.
(Use the right-left arrows to toggle between stats for the week and the season).
Points per drive ranks the defense only 17th but that is biased by Denver’s 2nd best starting field position. By DSR, the Colts’ defense ranks 4th, which matches the 4th lowest defensive success rate (adj TSR), as Indy gave up only 3.2 yards per play, the lowest of any defense for the week.
The Colts limited explosive plays and earned 3 takeaways. It is unfortunate that the offense kept trying to give Denver points, because this is the best the defense has looked in a long time.
On the year, the defense jumps 2 spots to 14th in PPD and 18th in DSR. DVOA has them right in the middle of that at 16th.
(Use the right-left arrows to toggle between stats for the week and the season).
Through the air, the Colts gave up the 15th lowest EPA per dropback, but only the 10th lowest Passing Success Rate. Bo Nix was able to cash in on those short fields and managed 3 TDs, which helped lift his value a lot higher than his average play.
He had the 5th lowest net yards per dropback, which led to the 2nd lowest conversion rate (1st/d). His completion rate was almost 9% below expected (4th lowest cpoe) and he managed only 1 explosive play. In addition, the Colts picked him 3 times and limited him to 121 net yards.
Wit this effort, the Colts passing defense jumps 3 spots to 14th in EPA/d but only 22nd in PSR. The truth is probably somewhere in the middle. DVOA says 18th, so let’s go with that.