 Cat Scratch Reader
Bryce Young’s 2024 comeback story told by a collection of interesting stats and graphs from the internet
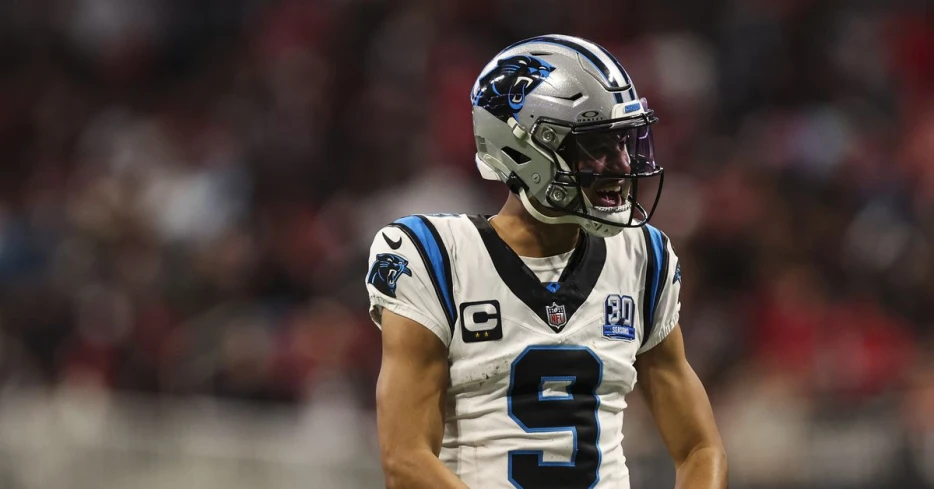
After the tumultuous start to Bryce Young’s career, there were very few people left on the planet who still maintained belief that he would be a good NFL quarterback. It’s no exaggeration to say that the first 18 games of his career were cumulatively some of the worst from a first overall pick in NFL history.
A complete rebuild of the offensive coaching staff and offensive line for the Carolina Panthers gave us an offseason of optimism in 2024. The theory was that the Panthers had elevated the offense to a point that evaluators would be able to get a true evaluation of Young. The hope inherent in that theory came crashing down almost instantly after Young’s very first pass attempt of the season was intercepted.
About 7.5 quarters of football later, Young had been benched and Andy Dalton was set to start for the foreseeable. The media lambasted the organization and effectively eulogized Young’s lost career while fans dialed up photoshopped images of Cam Ward and Shedeur Sanders in process blue.
But then Young was thrust back into the lead role after Dalton was in a minor car accident and fans feared more of the same was coming. Instead, something seemed to click in a big way.
He went from looking barely competent in the first game, to winning a couple games against poor opponents. Then he took both eventual Super Bowls teams and the NFC South division winner (the Kansas City Chiefs, the Philadelphia Eagles, and the Tampa Bay Buccaneers for those of y’all following along at home) to the wire in 3 straight games, followed by shining in the final 3 games of the season to cap it off with his best game as an NFL player.
On the back stretch of the season, Young passed the eye test for most onlookers. But the eye test is not the only thing that matters any more. Now there are a million and one ways to evaluate players based on numbers alone. Spend 15 minutes on the football side of social media and you’re bound to see a new chart, graph or statistic that adds context to Young’s final stretch.
Impressive as they are when you are just scrolling by, taking an in-depth look at them all at once paints the story of just how impressive the sophomore signal caller was to cap the season.
First of all, a big thanks to Jacob Gibbs of CBS Sports for putting the below tables together and including some corresponding film cut-ups. They tell quite the story of Young’s ability when given time to operate in the pocket.
In the short area of the field, Young was a standout. While being QB5 in catchable ball rate is great, taking the second and first spots in ‘highly accurate throw % to open receivers’ and ‘highly accurate throw %’ are exactly what you wanted...