 Gang Green Nation
For those of you who don’t know, statistics is a big part of my day job. One could argue that it’s the most important part of my day job.
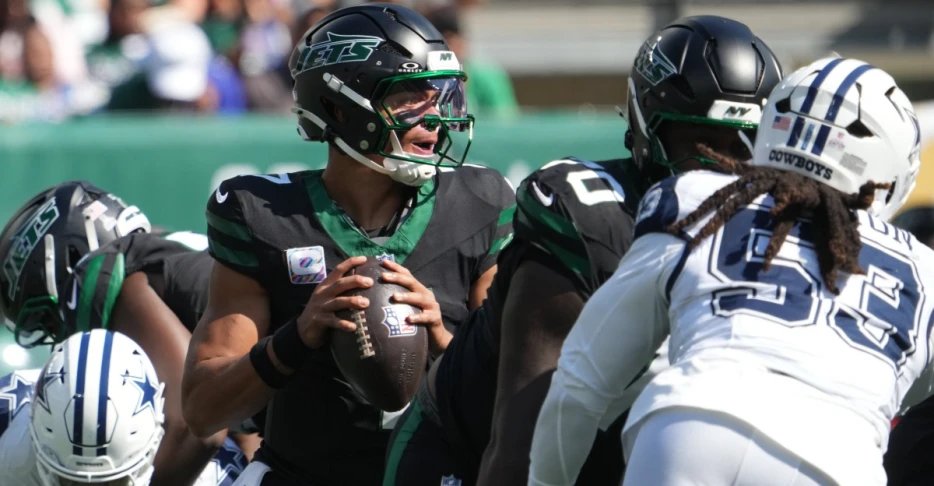
Because of that, I always think the data behind sports is where some of the juiciest stuff is. One statistic that I’ve always been fascinated by but could never really find the raw data to dive into with any real rigor is time-to-throw. Why? Because I think using the average for this statistic is pretty short-sighted as currently reported, and, as it turns out, New York Jets quarterback Justin Fields agrees.
As said by Fields:
“I don’t really look at stats if I’m being honest with you. I’m not on social media. My job is to put as many points up on the board, whether that’s the least amount of time to throw or that’s the most. I feel like that’s not a good indicator cause you’ve got guys that scramble & then they count that, so pocket passers will have the least time to throw because they scramble the least. I remember one of my years in Chicago they said I had the longest time to throw too, but at the same time I’m scrambling behind the line of scrimmage, so of course they’re gonna count that, so I don’t think that’s a credible stat for the QB position if I’m being honest with you.”
Admittedly, this might sound at face value like a quarterback explaining away why a statistic that reflects poorly on him is bad. It would hardly be the first athlete to do this. However, logically, I think Fields is up the right tree here.
First, scrambling does harm time-to-throw statistics. When he opts to extend to extend a play with his legs, that harms his time-to-throw and when you do that regularly it skews it, even if the team regularly benefits from just like that we see all the time with quarterbacks Lamar Jackson and Josh Allen who are two the best quarterbacks in the league but also rank poorly on this stat. As an example of why that happens, let’s use two worked examples as shown below
In comparing to two based on the raw data, they overlap 80% of the time. The difference is quarterback A had two scrambles to extend plays whereas quarterback B opted to get the ball out instead of scrambling; importantly, you should remember that scrambles can be beneficial for the team but can never benefit time-to-throw as currently reported. Overall though, the distribution is really similar, but the average for A is 2.9 seconds and the average for B is 2.5. For context, [a .4 second difference in time-to-throw is the difference between the fastest time to release and the 30th...