The most important number in Sunday’s New York Giants-Washington Commanders matchup is 15. That is the combined number of consecutive losses between the two teams. Here are some of the other numbers to know.
From NextGen Stats
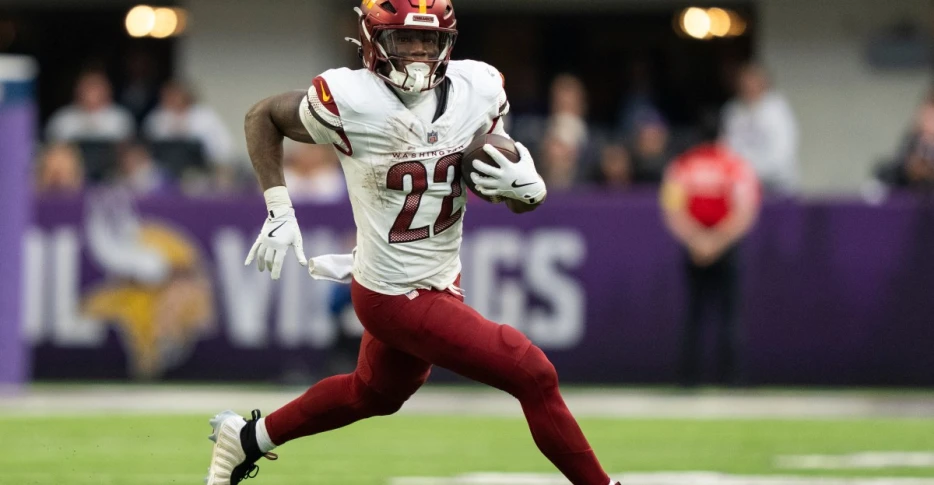
- TEST FOR RUN DEFENSE: Jacory Croskey-Merritt of the Commanders has gained the most yards per carry (6.6) while recording the 2nd-highest missed tackle forced rate (41.7%) on carries outside the tackles this season (min. 25 carries). Croskey-Merritt has gained positive EPA on 56.3% of his outside carries (highest) while 22.9% of such rushes have earned 10+ yards (2nd-highest). Matchup: The Giants have allowed the most yards per carry (7.0), the highest success rate (54.8%) and the highest explosive play rate (25.0%) to ball carriers on outside rushes this season.
- BAD MATCHUP? The Giants have allowed the sixth-most yards per play (6.3) and the furth-highest explosive play rate (17.2%) against 11 personnel this season. While the Giants have allowed just 6.8 yards per attempt (13th-fewest) and a 42.9% dropback success rate (14th-lowest) against 11 personnel, they have forfeited 6.9 yards per carry (most) and a 51.9% success rate (second-highest) against the run, with 20.3% of these carries gaining 10+ yards (highest). Matchup: The Commanders have averaged 5.4 yards per carry (8th-most) and a 50.0% success rate (fourth-highest) when rushing out of 11 personnel this season.
- TUNSIL vs. CARTER: Laremy Tunsil has allowed the 6th-lowest pressure rate (7.5%, min. 150 pass blocking snaps) and the 5th-longest time to pressure (3.22 seconds) among left tackles this season (min. 20 pressures allowed). Tunsil has given up three of fewer pressures in 9 of his 12 games played, tied for the 3rd-most among all left tackles (min. 20 pass blocking snaps in each game). Matchup: Abdul Carter has generated pressure in under 2.5 seconds on 7.8% of his pass rushes this season, the 6th-highest quick pressure rate in the NFL (min. 150 pass rushes).
Giants offensive rankings
Total Yards Per Game: 340.1 | 14th
Rushing Yards Per Game: 123.5 | 13th
Passing Yards Per Game: 216.6 | 15th
First Downs Per Game: 20.5 | 9th
Third Down Conversion Rate: 41.14% | 11th
Fourth Down Conversion Rate: 45.16% | 25th
Red Zone – TD Rate: 47.62% | 29th
Average Time of Possession: 30:30 | T-11th
Points Per Game: 21.5 | 23rd
Giants defensive rankings
Total Yards Allowed Per Game: 385.8 | 31st
Rushing Yards Allowed Per Game: 154.2 | 31st
Passing Yards Allowed Per Game: 231.5 | 24th
First Downs Allowed Per Game: 22.5 | 31st
Opponent Third Down Conversion Rate: 40.65% | 21st
Opponent Fourth Down Conversion Rate: 71.43% | 29th
Red Zone – Allowed TD Rate: 65.96% | 29th
Points Allowed Per Game: 28.2 | 30th
Giants special teams rankings
Punt Return Average: 8.7 | 22nd
Kickoff Return Average: 27.0 | 8th
Field Goal Percentage: 93.75% | 3rd
Opponent Punt Return Average: 12.6 | 23rd
Opponent Kick Return Average: 24.1 | 7th
Commanders offensive rankings
Total Yards Per Game:...