 Blogging The Boys
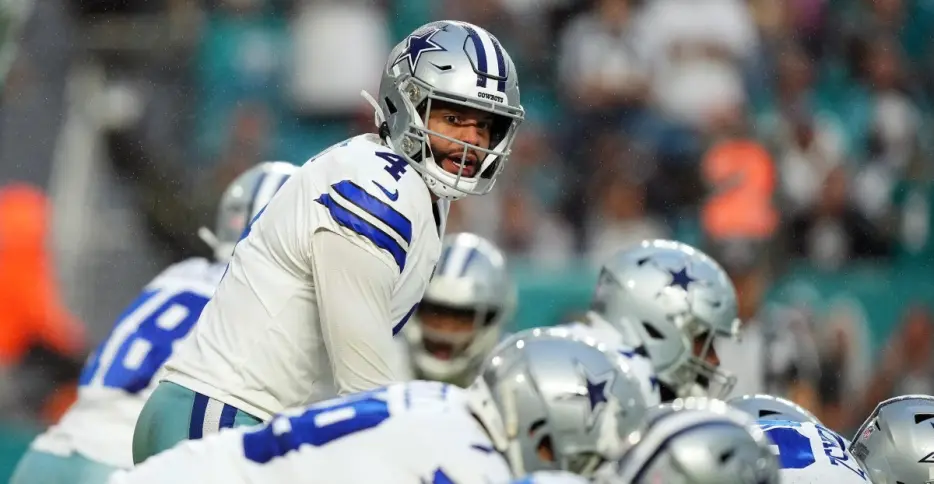
The Cowboys don’t have an offensive line problem. They have an edge protection problem.
The data from 2025 makes that distinction surprisingly clear. While both tackle spots allowed well above-average pressure, Dallas’ three interior starters quietly performed at or above the NFL average.
Today, we look at how the Cowboys linemen compared against the NFL average in 2025, how many splash plays (sacks + hits + hurries) they gave up, and what that could mean for 2026. The numbers we’re going to use are from Pro Football Focus (PFF), but we’re only looking at their raw stats, not the grades. Importantly, the PFF numbers can differ from the official totals because PFF only lists splash plays that are directly attributable to an offensive line player.
But before we start comparing sacks, hits, and hurries among players along the offensive line, it’s important to understand that you can’t compare players without also accounting for their snap count, because one guy may have played 450 pass blocking snaps, while the other guy played 650 snaps.
Example: Tyler Guyton gave up 31 total pressures (sacks + hits + hurries) according to PFF. Buffalo’s Pro Bowl left tackle Dion Dawkins gave up 33 pressures. If you’re a proponent of volume stats, you would argue that both gave up almost the same amount of pressures. Technically, you’d be right, but Guyton reached his total in just 384 pass-blocking snaps, while Dawkins played 528. Once you account for workload, the comparison looks very different.
To make every player directly comparable, I’ve normalized all pressure statistics to 600 pass-blocking snaps, roughly a full season for an NFL starter.
Here’s how many sacks, hits, and pressures an average NFL O-line gave up in 2025, adjusted to 600 pass-blocking snaps.
body .sbnu-legacy-content-table td, body .sbnu-legacy-content-table th, body .sbnu-legacy-content-table { border: 1px solid #000 !important; border-collapse: collapse !important; } body .sbnu-legacy-content-table td, body .sbnu-legacy-content-table th { padding: 4px 6px !important; } 2025 NFL average splash plays given up by O-line (adjusted)NFL averageLTLGCRGRTSacks6.13.21.83.34.0QB Hits6.75.03.53.74.4QB Hurries26.822.315.622.626Total Pressures39.830.420.929.6****34.4One interesting takeaway is that right tackles now allow almost as much pressure as left tackles. Whether that’s because elite edge rushers line up on both sides or offenses have become more balanced, the traditional blind-side gap has largely disappeared.
Now that we’ve established the baseline, or ‘average’ for these splash plays, let’s have a look at how the Cowboys five starting linemen compare. Note on the color scheme: green is better than the NFL average at the position, yellow is up to 25% below the NFL average, red is more than 25% worse than the NFL average.
body .sbnu-legacy-content-table td, body .sbnu-legacy-content-table th, body .sbnu-legacy-content-table { border: 1px solid #000 !important; border-collapse: collapse !important; } body .sbnu-legacy-content-table td, body .sbnu-legacy-content-table th { padding: 4px 6px !important; } 2025 splash plays given up by Cowboys O-line (adjusted)Cowboys StartersLT GuytonLG SmithOC BeebeRG BookerRT SteeleSacks3.12.21.43.15.4QB Hits9.40.04.16.38.1QB Hurries35.921.316.316.733.4Total Pressures48.428.021.726.1****47.0When comparing each starter’s pass protection to the 2025 league average at his position, a clear pattern emerges: *Dallas doesn’t have...