Thanks to the nflFastR project, Pro Football Focus and NFL NextGen Stats for the timely sources of data.
For those of you new to this, I will publish key QB stats each week judging how well the Colts’ QB performed. Yes, O-Line, receivers, and play-calling impact these numbers but they are primarily QB measures. I will probably modify the charts throughout the season. Commentary will be brief but feel free to let me know in the comments that stats aren’t everything. (click charts for larger view)
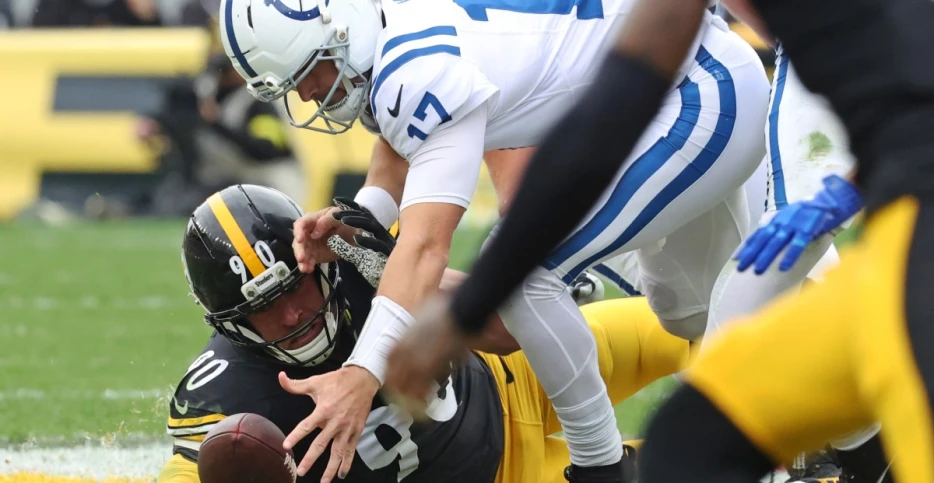
It’s easy to write an analysis when everything’s going great. But when the wheels come off, you have to figure out why. And that “why” tends to divide fans into two groups: those who excuse a quarterback for a bad outing —and those who don’t. Consider me a “don’t” guy.
For the “not-the-QB’s-fault” camp — outside of the five turnovers, he played okay. He posted a 49.2% success rate, which is a bit above the NFL average and ranked 15th for the week. However, in my clearly-not-so-humble-at-all opinion, quarterbacks are responsible for their turnovers and they are EPA killers. So, it’s no surprise that Jones’ -0.16 EPA per play ranked 29th this week.
Yes, pressure led to strip sacks, but maybe recognize the pressure and do something about it? And sure, the tipped-pass interceptions were flukes, but maybe throw over the free blitzer bearing down on you? And defintiely don’t throw the ball straight to a defender . . . twice.
My point is that plenty of quarterbacks have faced pressure in games this season — but, most of them didn’t turn the ball over five times. What’s the saying: “Once is happenstance. Twice is coincidence. Three times is bad bounces, I guess. Four times is, ummm, playing on grass(?). But five times? Maybe, that’s on you.”
It wasn’t just EPA that tanked this week — yards per play dipped down as well. Still, Jones managed the 16th-ranked pass play conversion rate, so he was able to somewhat move the chains until turnovers ended the drives.
His completion rate (adjusted to include pass interference) dropped below 65% for the first time this year. That’s still not terrible… as long as it’s your teammate making the catch. His 7.1 yards per attempt is below average, but not significantly so. Other than the picks, those are all kind of “okay” numbers.
He maintained an above average depth of target and depth of completions.
For the 2nd week in a row, Pittman and Pierce had big days, nearly matching each other in total receiving depth as both went over 100 yards. Warren had an off day with 5 catches for 26 yards.
Pittman has taken the lead over Warren in total yards, with both still vying for 1,000-yard seasons.
The per target value was basically below average for everyone this week. Part of that is fewer completions, but also just lower value throws.
This game...


