I’ll start by saying this: writing these reviews is a LOT easier after a win. Last week, I had to bang out the Week 2 recap with America’s Team: The Gambler and His Cowboys playing in the background, perhaps as a weird little psyche-up session before Week 3. Being a Dallas native, I also happened to swing by AT&T Stadium the Saturday before kickoff for the DFW Card Show. I got a chance to walk on the same field the Cowboys play on. (Don’t worry, I didn’t sneak out there; the expo was set up at the field level.)
Not sure if any of that really matters, other than it all ties back to the Dallas Cowboys, the very same team your Chicago Bears just handled, 31–14, at Soldier Field. Caleb Williams delivered his best all-around performance yet: 19-of-29 for 298 yards, 4 touchdowns, 0 interceptions, a sparkling 142.6 passer rating, and maybe most importantly, 0 sacks for the first time in his career.
In what many are calling the best game of his young career, Williams vaulted into the top tier statistically: 9th in passer rating (107.7), 8th in Big Time Throw Rate (6.0%), 2nd in touchdown passes (7), 7th in deep-ball passing grade (92.8), 11th in overall passing grade (78.1), and 8th in Turnover-Worthy Play Rate (1.7%). (Stats courtesy of PFF.)
So let’s get into it—what made this start so special?
Side note for the analytics crowd: I stumbled across a new metric about a week ago called QBERT, created by Nate Silver. If you’re a baseball analytics nerd, think of it like a wRC+ for quarterbacks, with a WAR-style component baked in. Very cool stuff, worth checking out!
(Season Averages in Italics)
C/A: 40/65 (61.5%) | 19/28 (67.9%)
Yards: 209.5 | 298
aDOT: 8.6 | 9.2
Touchdowns: 2 | 4
Turnovers: 0.5 | 0
QB at Fault Sacks: *1.5 | 0
Passer Rating: 89.2 | 142.6
True Passer Rating: 119.8 | 187.7
Time to Throw: 3.09s | 2.95s
Time to Pressure: 2.66s | 2.54s
Pressure Rate: 29.07% | 35.48%
On-Target Rate: 61.3% | 65.5%
Poor Play Rate / Big Play Rate: 18.0% PPR / 6.7% BPR | 5.7% PPR / 14.3% BRP
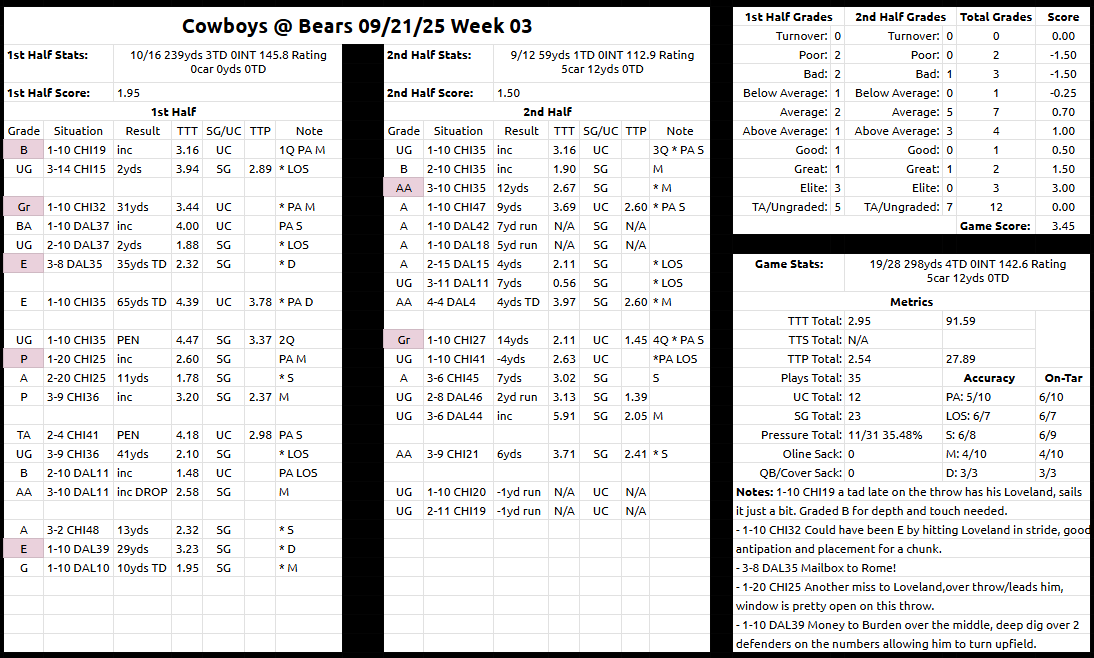
The full grading sheet for each play can be found here.


