Thanks to Pro Football Focus, Pro Football Reference, NFL.com and the nflFastR project for being awesome sources of weekly data.
I’ve spent the offseason enhancing my data and created a new graph I’m excited about. To test it out, I’m comparing Anthony Richardson and Daniel Jones.
The graph offers a focused look at quarterback efficiency—one of the best ways to evaluate performance and project future success. Of course, as I’ve been told once or twice, no single stat tells the full story—which is why I use a range of metrics to paint a more complete picture.
The graph presents a progression of efficiency metrics, starting with simple measures and gradually incorporating more elements of quarterback play, ending with a comprehensive final stat. It’s similar to what I do in my weekly QB dashboards, but with a sharper focus and a few new measures to fill in some gaps.
I’ll take it step by step.
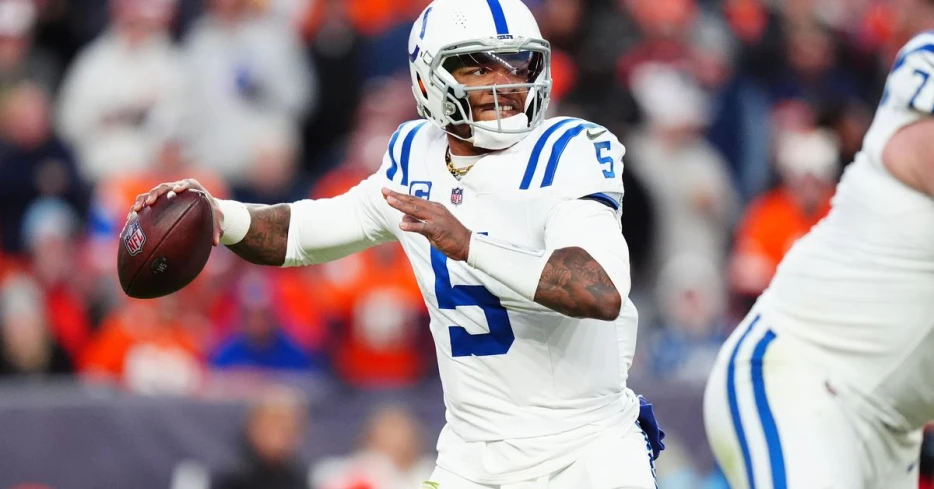
This is the graph with just the beginning and ending numbers for Anthony Richardson’s 15 career starts.
The ending metric is overall EPA efficiency. I’ve typically used EPA per dropback, but with the rise of running quarterbacks, most analysts now include designed QB runs — shifting the metric to EPA per play (EPA/p). I could write a thousand words on why designed runs shouldn’t be part of QB stats, but it’s not a hill I’m willing to die on. Since everyone else is including them, fine—I’ll throw them in too (although I really shouldn’t). Unfortunately, Richardson ranks 25th out of 32 by that measure.
My starting metric is air yards per completion on passes under 20 yards. I know that’s an obscure thing to measure, but the desire is to capture passing depth without explosive plays. Richardson’s fourth-ranked depth shows he isn’t simply checking the ball down. Despite this, he has still struggled to consistently translate other aspects of his play into overall value.
As I add more stats, the blue line beomes an efficiency curve that highlights the underlying causes of those struggles and explains why he’s been one of the league’s least efficient quarterbacks thus far in his career. To that end, I’ll now layer on the remaining air yards from his deep completions.
Richardson gets 9.5% of his completions on passes of 20+ yards, the fifth-highest rate among all quarterbacks. That contributes to a league highest 7.7 air yards per completion (ay/c), meaning no one throws deeper completions.
Next, I’ll add the complement to air yards— yards after the catch (yac).
Not only does Richardson throw deep on his completions, but he also benefits from the second-highest yards after the catch, leading to the most yards per completion (yd/c) in the league.
For a graph meant to measure a drop in efficiency, it looks like I’m going in the wrong direction. Let’s fix that by adding incompletions—you can probably guess where this is headed.
Ooph. Richardson is dead last in completion rate. I even...


