To help pass the time from now until the start of training camp, we’ll be looking at where every team ranks in positional spending. We’ve hit each of the individual offensive positions; now it’s time to put it all together for a team-by-team look at which organizations are allocating the most to the attacking side of the ball in 2026.
One note: rather than count dead money toward the positional groups, we will have it ranked separately in a post of its own. For example, Dolphins QB Tua Tagovailoa‘s $55.4 million dead cap hit won’t count toward Miami’s quarterback spending, but it will be included in their league-leading $179 million dead cap figure.
Here’s how each team’s offensive spending shakes out from most expensive to least expensive:
Resources:
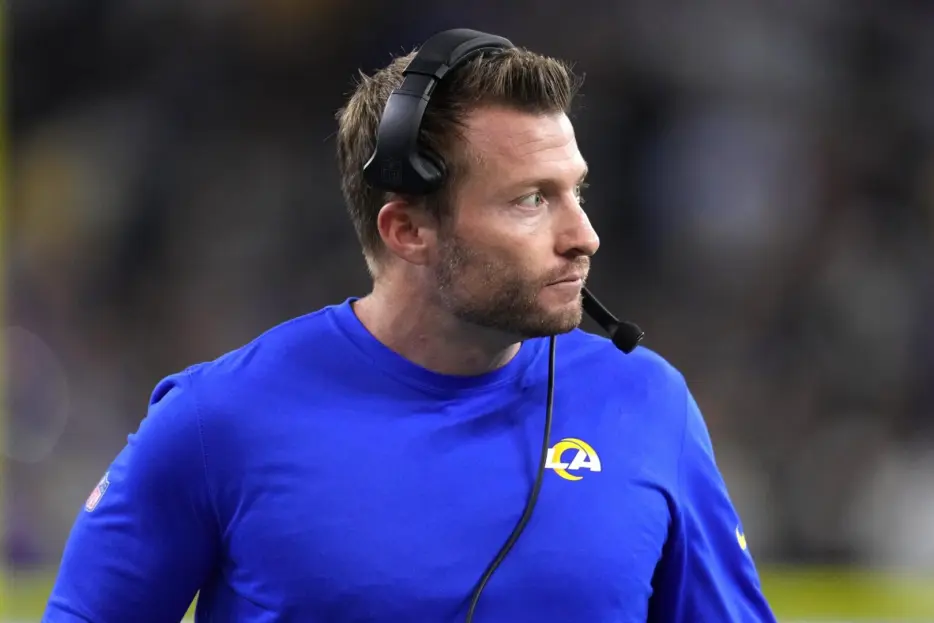
1 – Los Angeles Rams: $201,068,305
- Percentage of total cap: 66.76 percent
- 2025 rank: 4th
- Quarterbacks: 17.05 percent (1st)
- Running backs: 6.18 percent (5th)
- Wide receivers: 13.85 percent (10th)
- Tight ends: 7.2 percent (5th)
- Offensive line: 22.47 percent (8th)
- Top cap hit: QB Matthew Stafford, $48,266,668 (16.02 percent)
2 – Tampa Bay Buccaneers: $184,989,077
- Percentage of total cap: 61.42 percent
- 2025 rank: 22nd
- Quarterbacks: 14.64 percent (6th)
- Running backs: 4.54 percent (15th)
- Wide receivers: 15.43 percent (5th)
- Tight ends: 3.22 percent (29th)
- Offensive line: 23.59 percent (6th)
- Top cap hit: QB Baker Mayfield, $39,975,000 (13.27 percent)
3 – Dallas Cowboys: $182,649,312
- Percentage of total cap: 60.64 percent
- 2025 rank: 12th
- Quarterbacks: 15.63 percent (4th)
- Running backs: 3.99 percent (21st)
- Wide receivers: 20.51 percent (2nd)
- Tight ends: 5.4 percent (11th)
- Offensive line: 15.11 percent (23rd)
- Top cap hit: QB Dak Prescott, $43,508,430 (14.45 percent)
4 – Minnesota Vikings: $180,274,355
- Percentage of total cap: 59.85 percent
- 2025 rank: 16th
- Quarterbacks: 3.76 percent (26th)
- Running backs: 5.92 percent (6th)
- Wide receivers: 15.12 percent (7th)
- Tight ends: 9.75 percent (1st)
- Offensive line: 25.3 percent (4th)
- Top cap hit: RT Brian O’Neill, $23,115,657 (7.67 percent)
5 – Cincinnati Bengals: $179,105,041
- Percentage of total cap: 59.46 percent
- 2025 rank: 3rd
- Quarterbacks: 14.44 percent (7th)
- Running backs: 3.56 percent (25th)
- Wide receivers: 21.75 percent (1st)
- Tight ends: 5.22 percent (15th)
- Offensive line: 14.49 percent (25th)
- Top cap hit: QB Joe Burrow, $37,599,784 (12.48 percent)
6 – Detroit Lions: $174,067,552
- Percentage of total cap: 57.79 percent
- 2025 rank: 5th
- Quarterbacks: 13.71 percent (9th)
- Running backs: 3.81 percent (22nd)
- Wide receivers: 17.46 percent (3rd)
- Tight ends: 5.05 percent (17th)
- Offensive line: 17.76 percent (18th)
- Top cap hit: QB Jared Goff, $37,600,000 (12.48 percent)
7 – Buffalo Bills: $171,192,207
- Percentage of total cap: 56.84 percent
- 2025 rank: 8th
- Quarterbacks: 15.7 percent (3rd)
- Running backs: 4.04 percent...
 NFL Trade Rumors